
Collecting last distance offered data
This article explains what last distance offered is, the complexities of gathering it and how it is displayed on Locrating.
What is "Last Distance Offered"?
When offering places to applicants, state schools usually give priority to certain categories of children, such as children who:
- have Special Educational Needs (SEN)
- are being looked after by a local authority (i.e. in care)
- are the child of a member of staff
- have a sibling already at the school
- are from a particular religion (if it’s a faith school)
- live in a specified priority area
The "Last distance offered" is the furthest distance from the school that a child lives, who was offered a place at the school under the "distance criterion" (i.e. due solely due to how far they live from the school). For most schools, there will be a single distance reported.
So, as an example, a primary school with 30 available places might allocate places as follows:
- 1 place to a child under SEN
- 1 place to a child of a member of staff
- 8 places to siblings of existing pupils
- Then 20 places to children based on distance alone, with the furthest distance being 0.4 miles
- All other applicants, who live further away, are then rejected
Where is it published?
Last distance offered can often be found on school and local authority websites. Whilst some local authorities publish last distance offered, others don’t and the ones that do don’t always publish them for all schools. Further, the information is presented in a myriad ways, with each local authority having their own maps, pdfs and web pages; all presenting the data in slightly different ways. Collecting this data involves a lot of manual effort and is an arduous process, however due to popular demand, we are working our way through 150+ local authority websites collating the data and presenting it; and of course we then need to repeat the process every year!
How is it presented in Locrating?
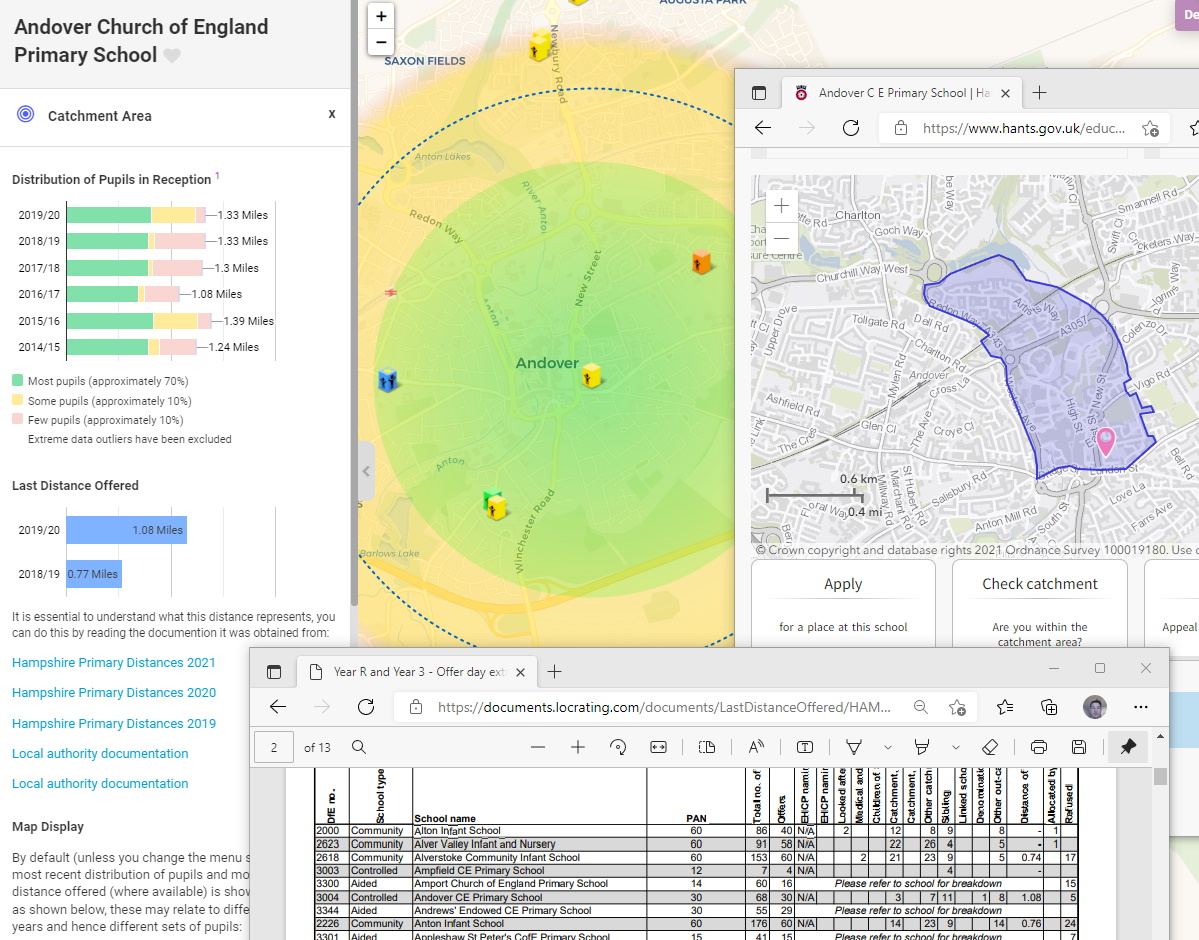
Where available the last distance offered can be seen on a school's home tab, as well as being plotted as a dotted line around the school.
What's really exciting, is that as we go around manually collating the data we can provide you will the interesting resources we find along the way; including not only where we have taken the last distance offered data from, but also web pages that show priority areas, sibling counts and other useful information, as shown below.
How does this relate to Locrating's catchment area indicators?
For the vast majority of oversubscribed schools we look at, we see a close correlation between the last distance offered and the green area of our catchment heatmaps.
As last distance offered is so difficult to collect and work with, we have historically avoided using it. Instead we've used data from the school census to show where existing pupils live (see Locrating's catchment areas explained), which, like last distance offered, can be used as a rough guide to indicate where you might need to live to gain successful entry to a school, based on past admissions.
We chose the school census route for a few reasons, firstly the data exists for all schools and hence we are able to process and display it in a reliable way for all school across the country. Secondly, there are a huge number of different ways that schools determine who to admit - in some cases you will see multiple last distance offered numbers for one school, as children are first put into groups (e.g. based on academic ability, location or faith) and then further sorted based on distance within those groups. Hence a single distance is not always enough to show the whole picture, especially where priority admission areas are concerned.
Hence, last distance offered does not remove the need for our catchment area indicators. Our catchment area shading and the ability to see where existing pupils live, still provides a really valuable insight into school admissions.
We are often asked why the distances we show don't match exactly those shown on council websites; the short answer is they are measuring different things (often for different years), the long answer is discussed in our blog post comparing Locrating catchment indicators with council cut off distances.
What is interesting, in undertaking this exercise and comparing the council data with our catchment heatmaps, is how closely for oversubscribed schools (where distance matters) this data matches. For the vast majority of oversubscribed schools we look at, we are seeing a very close correlation between the last distance offered from the council website and the green area of our catchment heatmaps.
We hope you find this extra information useful.
Author: Lewis Tandy
