
The English Indices of Deprivation
Since the 1970s the Ministry of Housing, Communities and Local Government and its predecessors have calculated local measures of deprivation in England. The Indices of Deprivation are a unique measure of relative deprivation (or affluence) at a small local area level. We're pleased to announce that we have now added the latest data (2019) to Locrating, which provides an interesting insight into the neighbourhoods where existing school pupils live.
National and local organisations use these measures, often in conjunction with other data, to distribute funding or target resources to areas. They are widely used across central government.
The Indices provide a set of relative measures of deprivation, based on seven different domains, or facets:
- Income Deprivation: Measures the proportion of the population experiencing deprivation relating to low income.
- Employment Deprivation: Measures the proportion of the working are population in an area involuntary excluded from the labour market.
- Education, Skills and Training Deprivation: Measures the lack of attainment and skills in the local population.
- Health Deprivation and Disability: Measures the risk of premature death and the impairment of quality of life through poor physical or mental health.
- Crime: Measures the risk of personal and material victimisation at local level.
- Barriers to Housing and Services: Measures the physical and financial accessibility to housing and local services.
- Living Environment Deprivation: Measures the quality of both the 'indoor' and 'outdoor' local environment.
Deprivation is measured in a broad way to encompass a wide range of aspects of an individual’s living conditions. Each of the domains above are constructed from a basket of different data datasets, or indicators.
We're pleased to announce that we have added the latest data (2019) to Locrating. We already show where existing pupils live using Lower-layer Super Output Areas (LSOAs), so the Deprivation data, which is also measured at a LSOA level, ties in nicely with that.
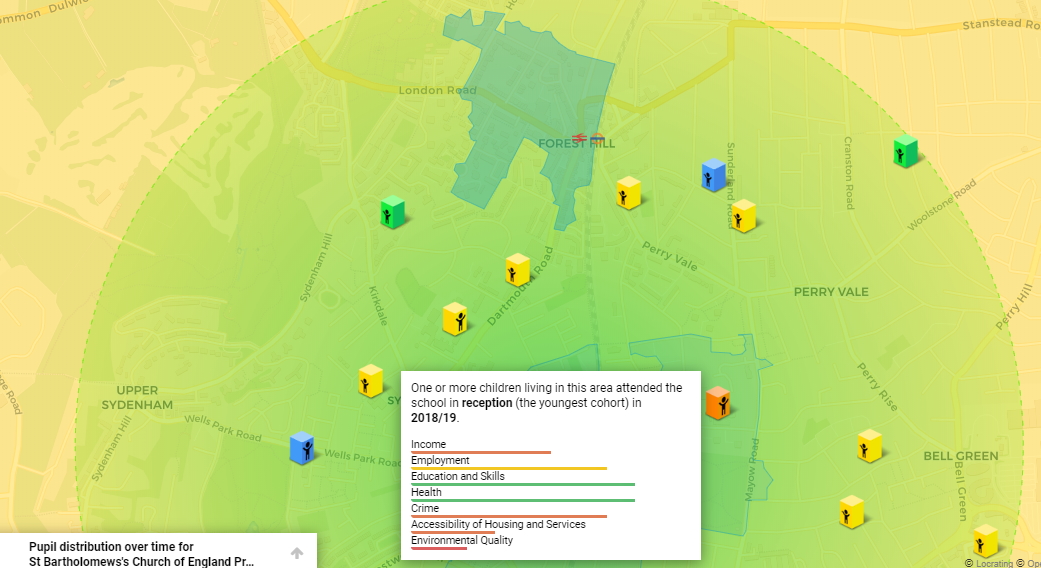
When you hover over a shaded purple area (LSOA) you can now see at a glance all the Deprivation measure listed above, which provides an interesting insight into that particular neighbourhood. Although the word deprivation is used above, these measures can equally be used as a measure of affluence; where a low deprivation equates to a high affluence.
As a bit of background, Lower-Layer Super Output Areas (LSOAs) are a standard statistical geography designed to be of a similar population size, with an average of approximately 1,500 residents or 650 households. There are 32,844 LSOAs in England. They were produced by the Office for National Statistics for the reporting of small area statistics and are a standard way of evenly dividing up the country by population. For ease of communication, LSOAs are sometimes referred to as ‘neighbourhoods’.
National and local organisations use these measures, often in conjunction with other data, to distribute funding or target resources to areas. They are widely used across central government.
Author: Lewis Tandy
