
What can we learn from 2022 admissions data?
Now that 2022 admissions data is available, what can we learn from the data?
The headline statistics are as follows: the number of children, in England, who were offered a place at their first preference school, this year, has gone up for secondary schools (83.3% up from 81.1%) and for primary schools (92.2% up from 91.8%).
This year there were 1.5% more secondary school applications (614,000) and 0.8% less primary school applications (576,100).
The drop in primary applications being likely the result of the continued drop in births seen from 2016 onwards.
The increase in secondary school applicants who received an offer of their first preference school is likely affected by the return of selective school (i.e. grammar school) tests to their original timetable.
Due to Covid, in 2020, the Department for Education asked admission authorities to delay testing for the 2021 selective school intake to give children as much time back in education as possible. Therefore, for 2021 entry, parents and carers had to name selective schools on the application form without knowing if their child had reached the standard required to be eligible for an offer.
In 2021, the selection tests returned to their normal timetable. Thus applicants for 2022 entry knew whether they were eligible to be considered for selective schools before having to make their school choices. This allowed preference rates for the affected local authorities to potentially increase as they did not have to reject preferences where the applicant subsequently did not reach the standard required to be eligible for an offer.
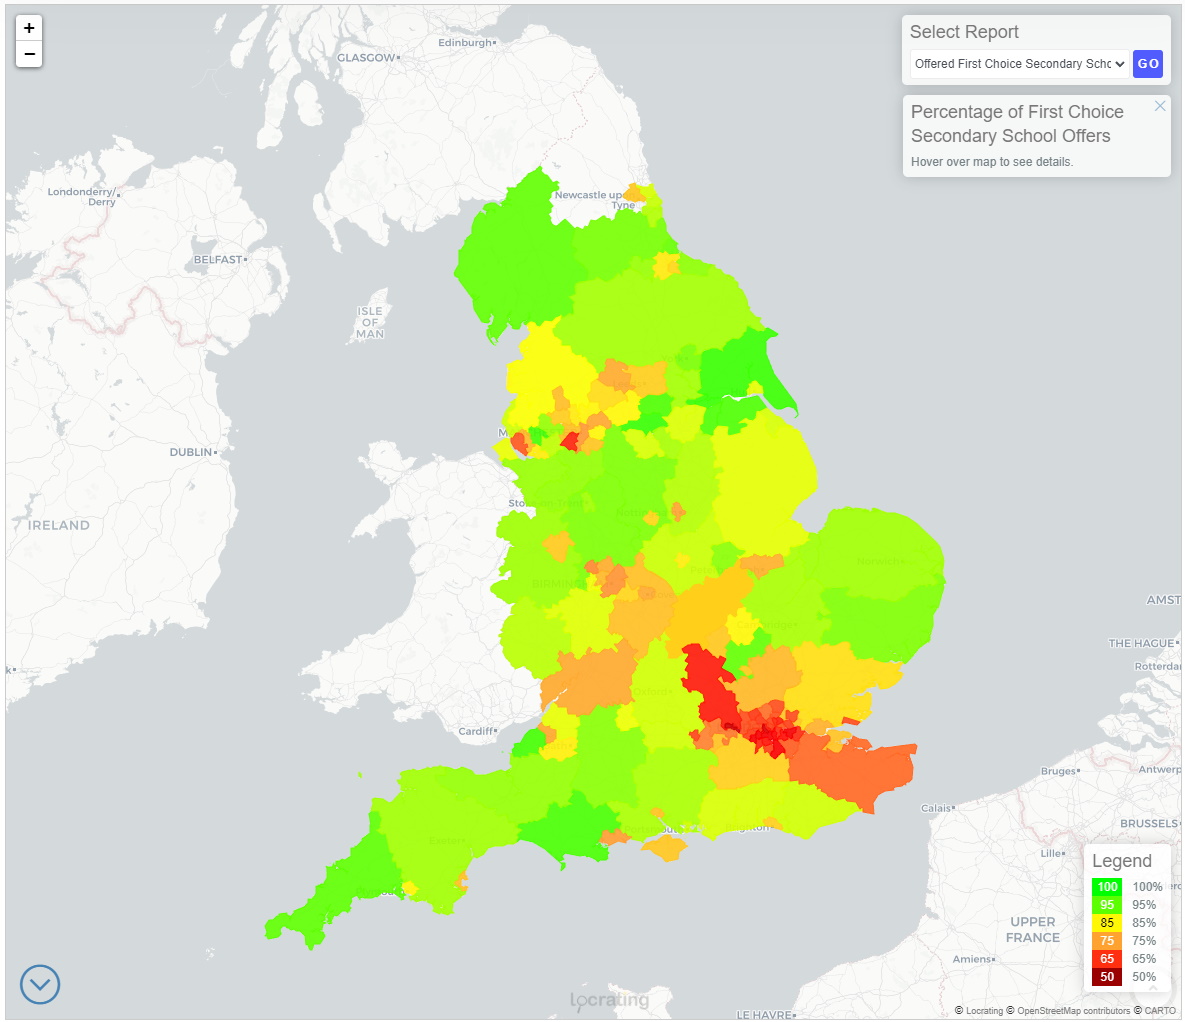
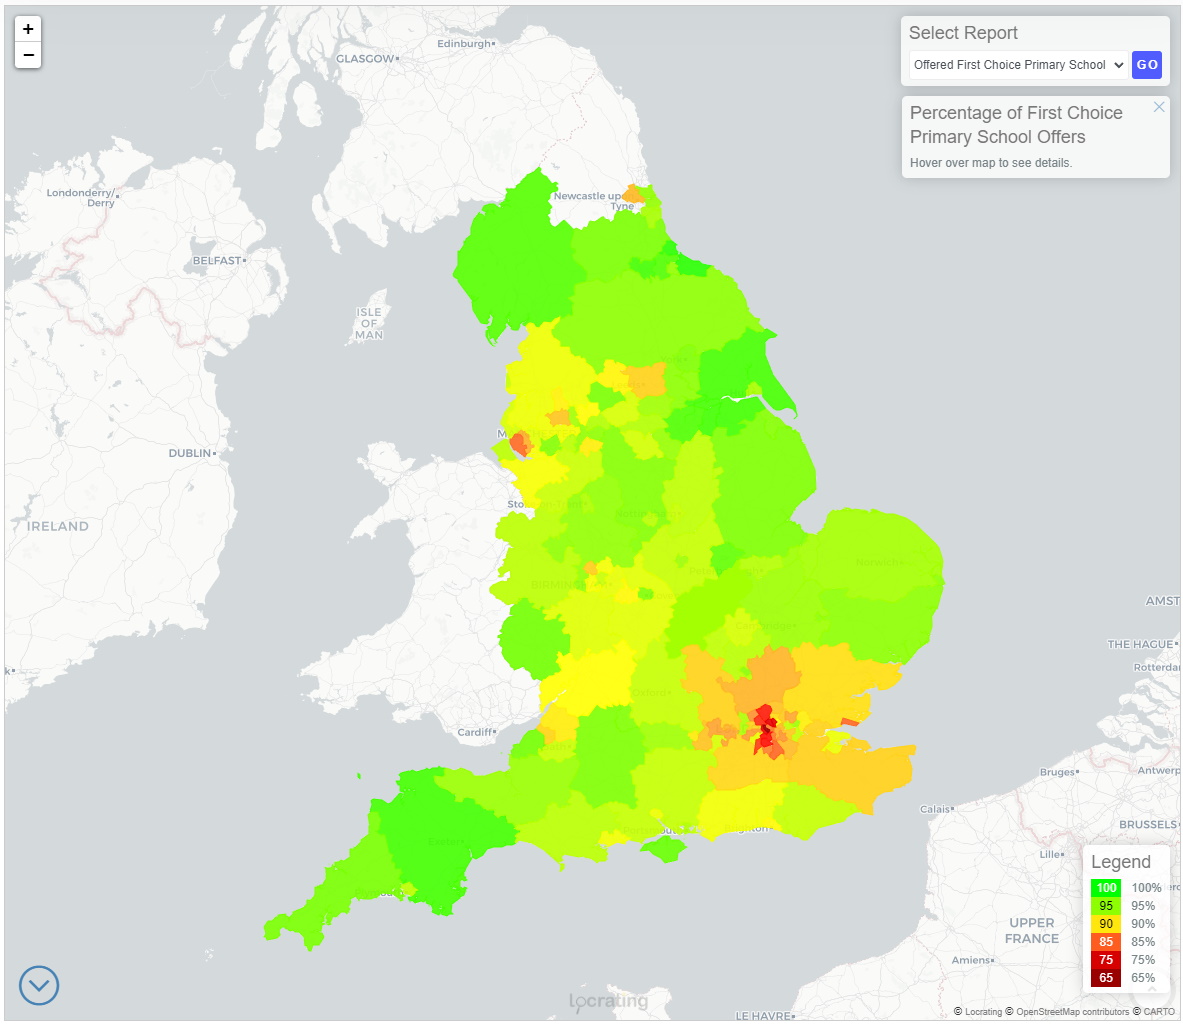
You can see in the heatmaps below how this has played out across the country:
| 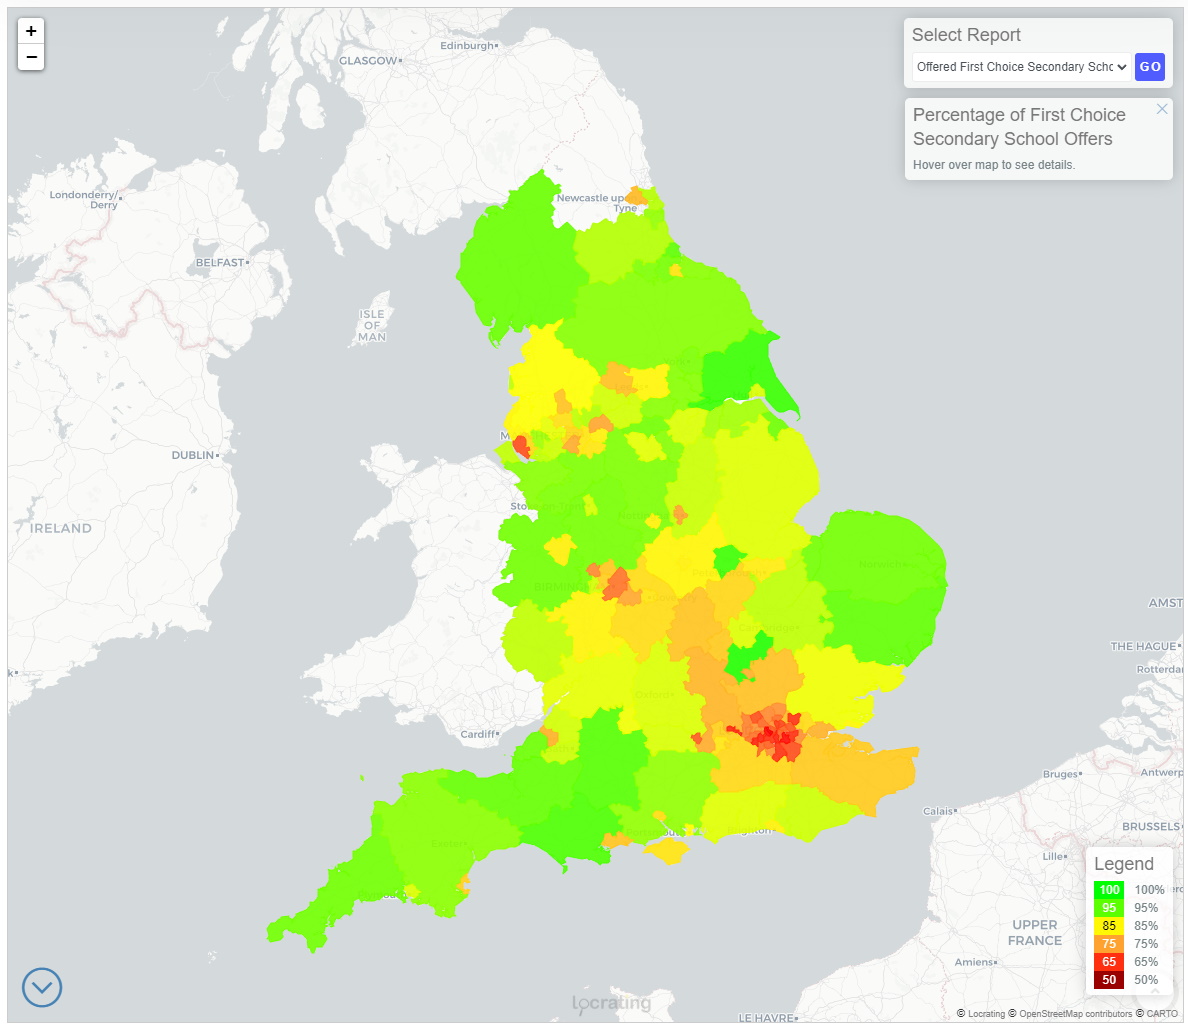 |
| 2021 Secondary School Admissions | 2022 Secondary School Admissions |
 |
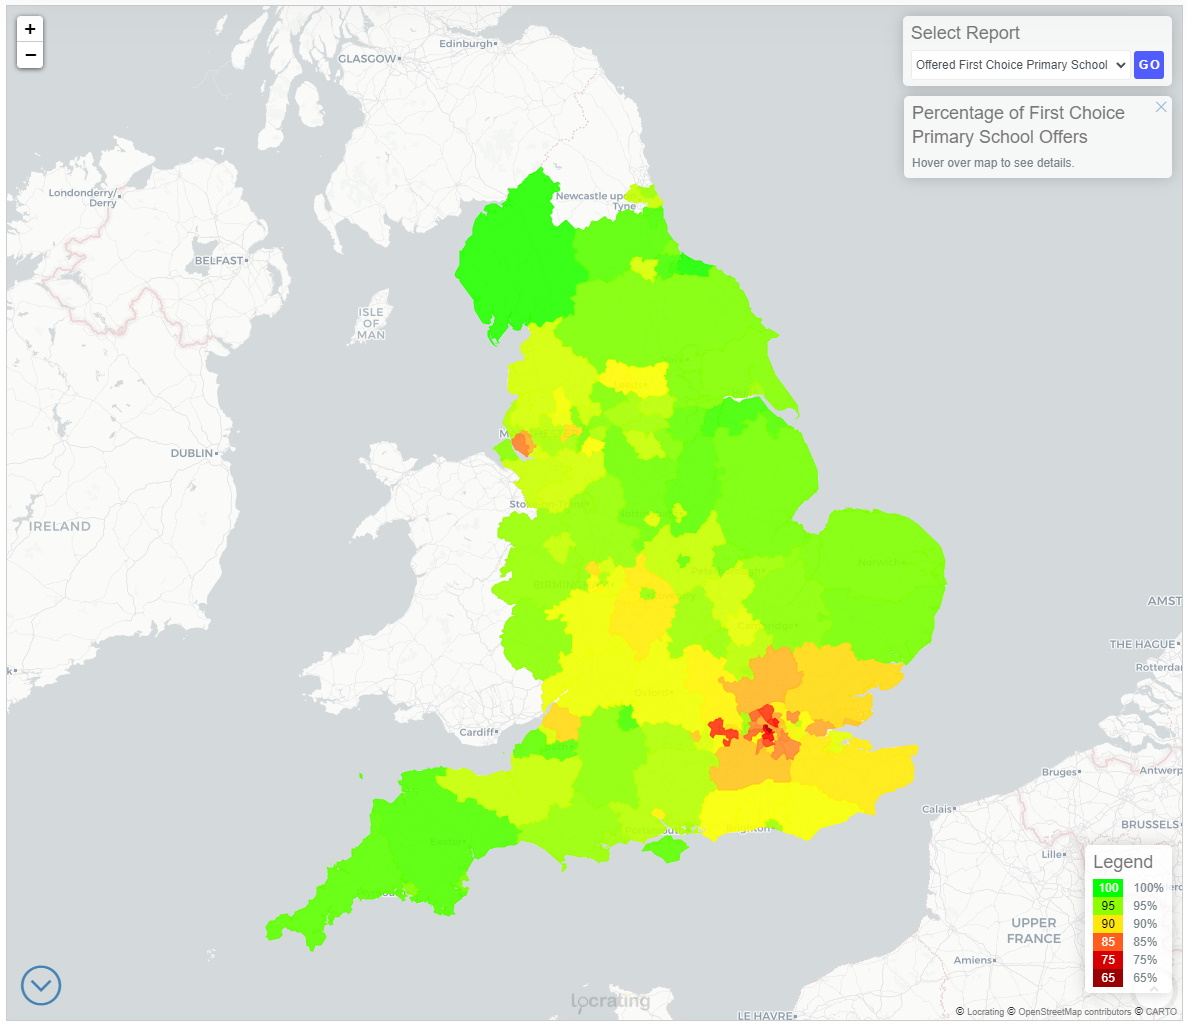 |
| 2021 Primary School Admissions | 2022 Primary School Admissions |
At secondary level, the areas with the highest first preference rates in 2022 where:
- Central Bedfordshire (98.19%)
- East Riding of Yorkshire (96.93%)
- Rutland (96.66%)
Whilst the lowest rates were in:
- Kensington and Chelsea (60.54%)
- Lewisham (61.99%)
- Hammersmith and Fulham (62.14%)
London local authorities continue to dominate the bottom of the chart, highlighting the continued pressure on school places in the capital.
At primary level, the areas with the highest first preference rates in 2022 where:
- Redcar & Cleveland (98.94%)
- Cumbria (98.68%)
- Middlesborough (98.06%)
Whilst the lowest rates were in:
- Kensington & Chelsea (69.51%)
- Hammersmith & Fulham (80.79%)
- Wandsworth (82.52%)
Again, as for secondary schools, London local authorities feature heavily at the bottom of the chart.
You can explore the data and discover the numbers for your own local authority using our heatmaps, where we've added the ability to compare different academic years, so you can see for yourself how school admissions have changed between 2020 and 2022.
Author: Lewis Tandy
